Contract Lawsuits Rose 63% in Five Years. Here's Where America Fights Over Contracts
A 35-state analysis of contract lawsuits per 1,000 businesses. Who leads, who's surging, and what it costs. From DocsGenie Research.
Every business runs on contracts, and when those contracts break down, the dispute often ends up in court. Yet there is surprisingly little public data on where contract litigation happens. Court systems publish caseloads in fragments, raw filing counts simply favor the biggest states, and almost no one divides those counts by how many businesses a state has.
DocsGenie Research set out to close that gap. We obtained incoming contract case filings from state court systems through the National Center for State Courts, then normalized them against each state's business base to produce one comparable measure: contract filings per 1,000 businesses.
Tracked back to 2020, the same data shows many things. These include where disputes concentrate today and where they are accelerating.
Across the states in this analysis, roughly 4.6 million contract cases were filed in 2024, up 63% in five years. What follows is the full ranking, the five-year trend, the cost context that determines what a dispute is worth, and eight deeper findings, with sources and methodology laid out in full.
Key findings
Maryland leads the country
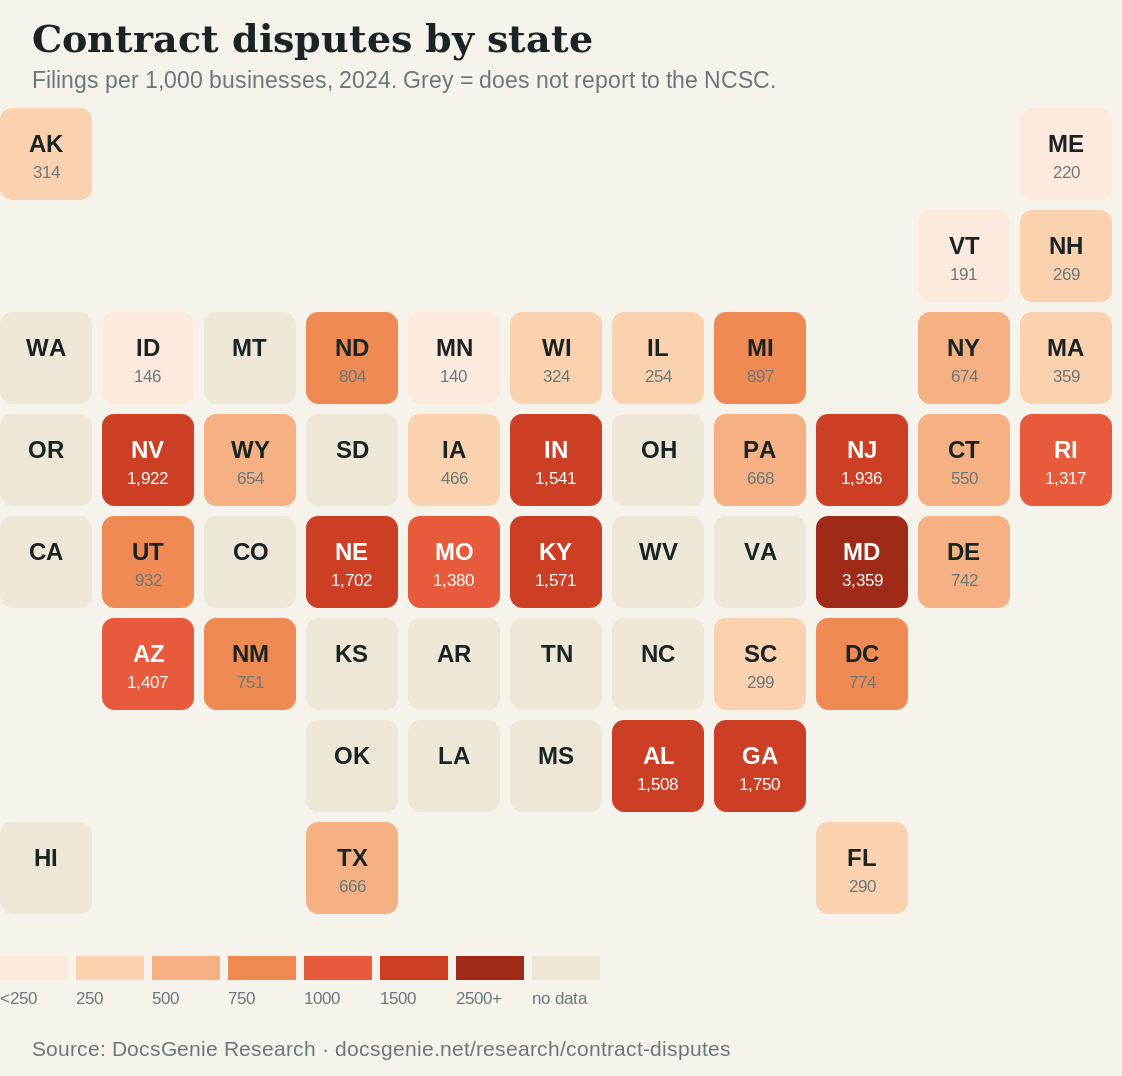
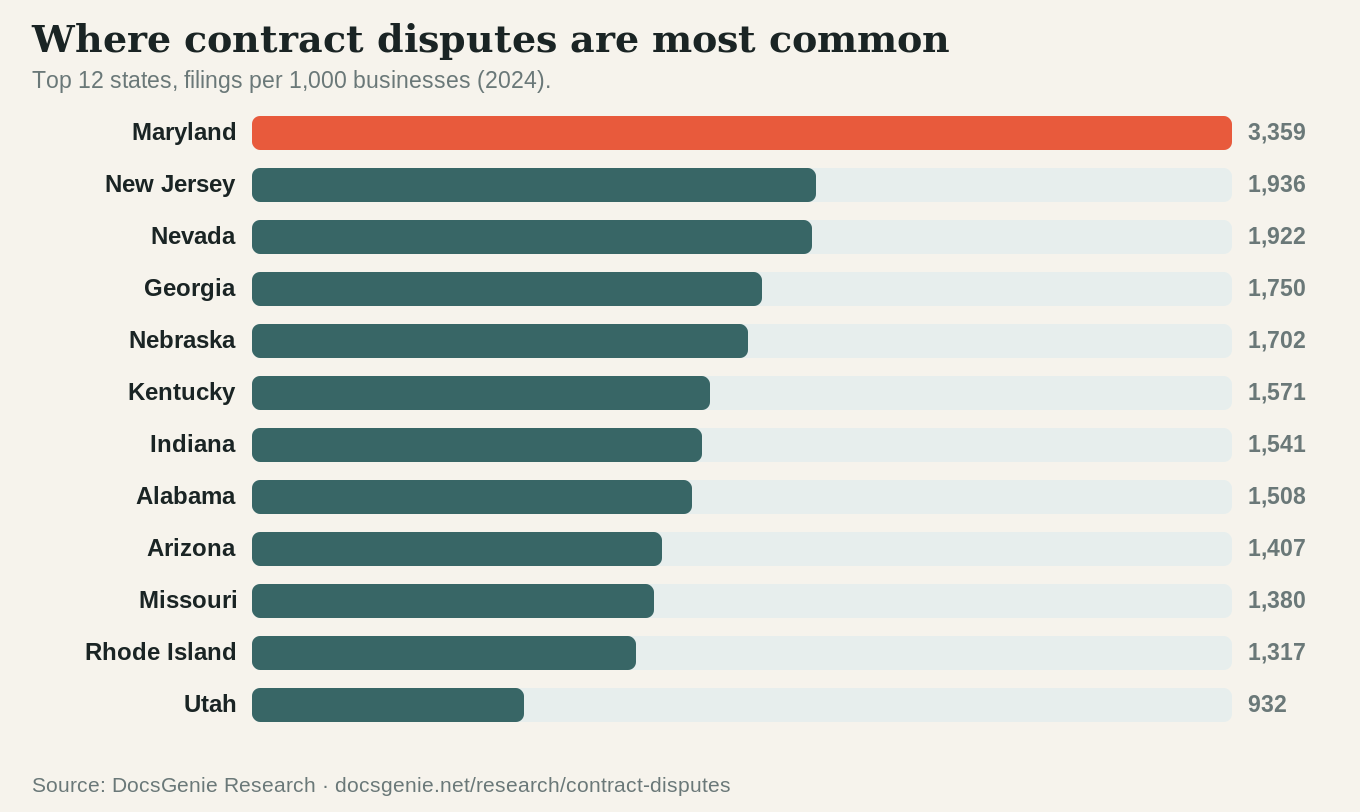
At 3,359 filings per 1,000 businesses, Maryland isn't just first, it’s a true outlier. It runs 4.8× the typical state and 1.7× the next-highest. Its District Court funnels enormous volumes of landlord/tenant and debt cases.
Litigation is climbing everywhere
Filings rose 63% from 2020 to 2024 across the states with full data, and every one of them increased. The trend shows a broad, durable rise rather than a one-off spike.
Normalization reshuffles the map
Once you divide out raw size, small states like Nevada, Nebraska, and Rhode Island rank far higher than their headline counts suggest, while giant Texas and Florida sit mid-table.
Volume isn't value
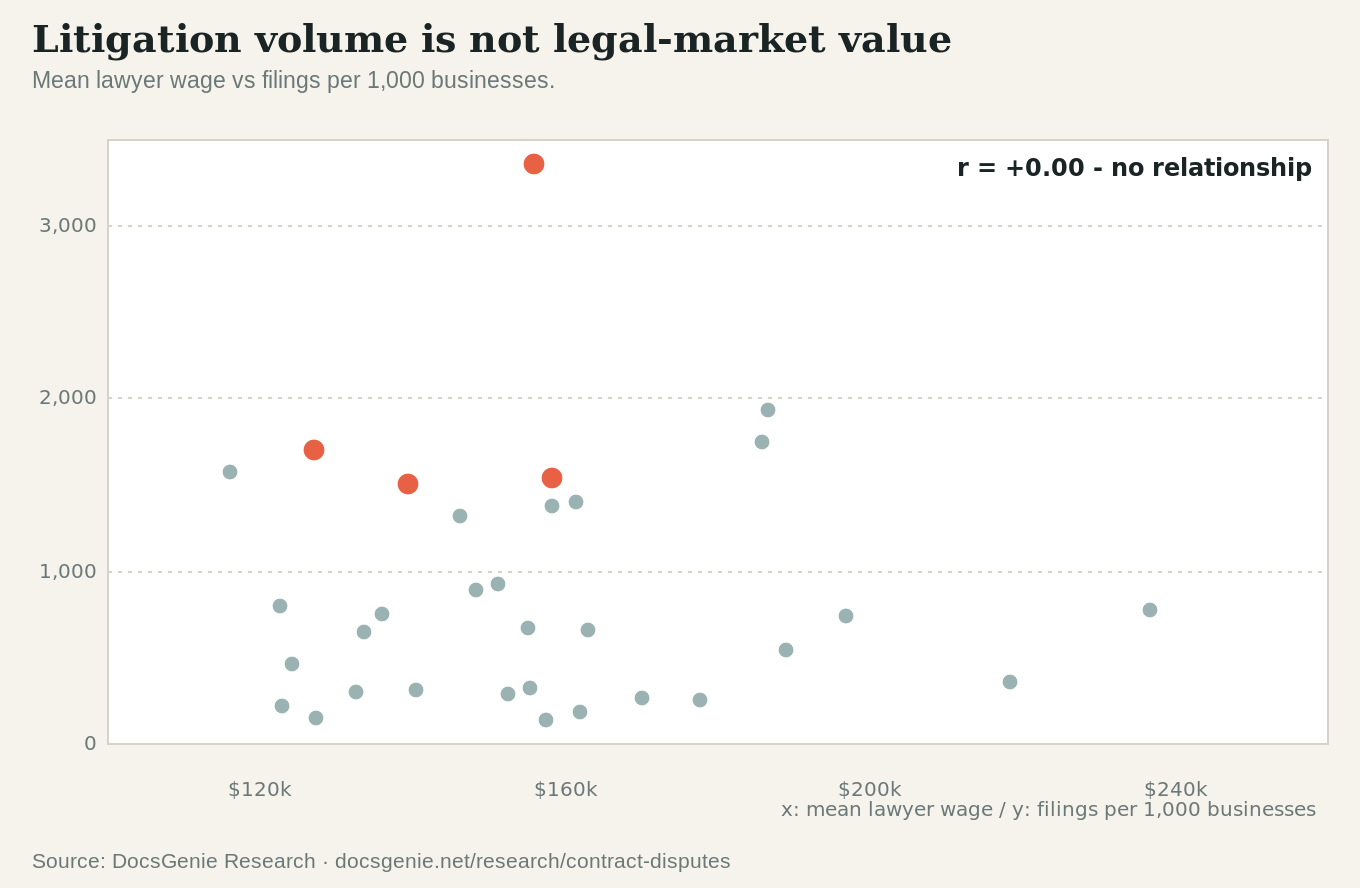
A state's filing rate has essentially no relationship to its lawyer wages, likely because of the nature of the cases. Many are high-volume debt and eviction filings, not big-ticket commercial litigation.
New York, properly mapped, is mid-pack
New York's literal 'contract' court line understates reality roughly 24-fold; re-bucketed to the national definition it reaches 364,412 filings, landing near Texas and Pennsylvania.
Contract disputes, state by state
Filings per 1,000 businesses. Grey states don't report to the NCSC. Toggle the metric; hover for detail.
Download this chart: PNG
Embed this map on your site
Free to reuse. The snippet includes the required "Source: DocsGenie" link back to this report.
The rankings
Raw filing counts are almost useless for comparison: a big state files more of everything. To make states comparable we divide incoming contract cases by the number of business establishments in each state, giving contract filings per 1,000 businesses. Because the latest business counts are from 2022, we report two cross-sections against that same 2022 base. A year-matched view (2022 filings) and a current-volume view (2024 filings), so the difference between them is pure filing growth.
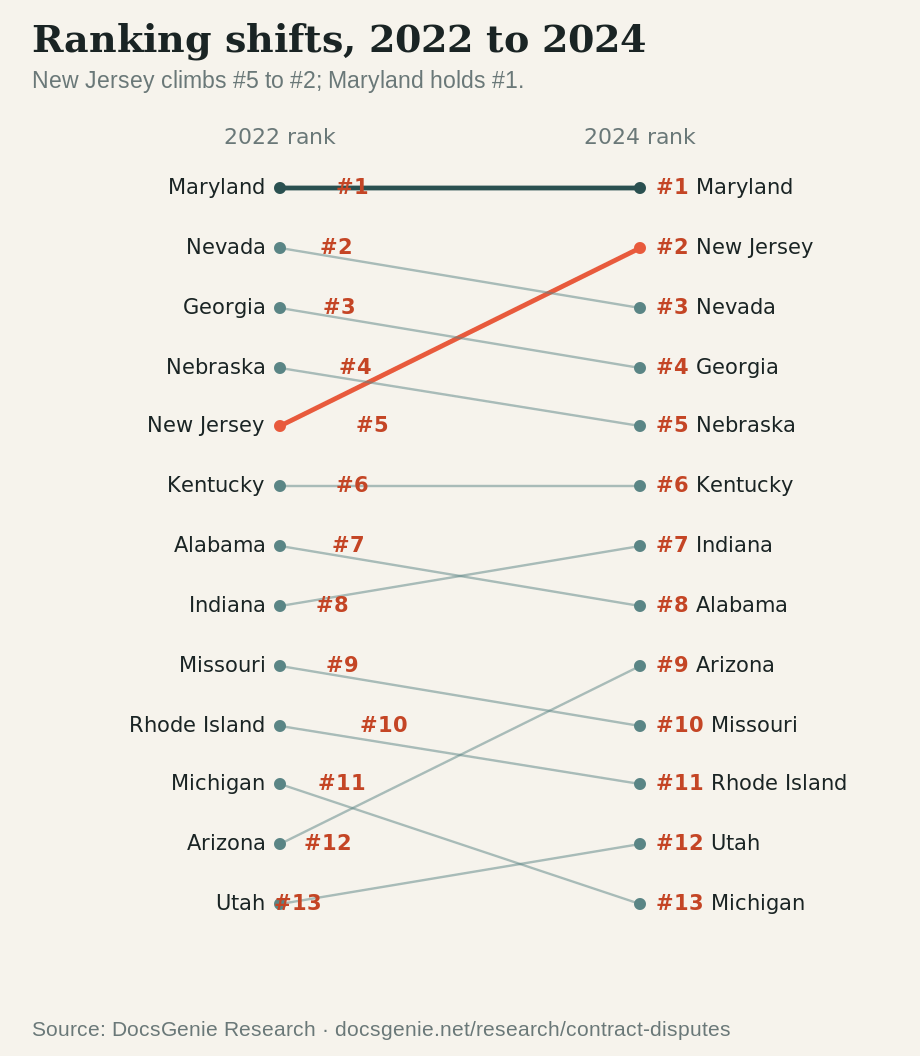
The ranking is stable at the top but not static. Maryland leads both cross-sections by a wide margin. New Jersey is the notable climber, rising from fifth in 2022 to second in 2024 on fast filing growth. The distribution is heavily right-skewed. A handful of states sit far above a long, gentle tail which is why the map uses binned color rather than a linear scale.
In the chart below, you can see the filings per 1,000 businesses and the filings per 1,000 population. Generally, it tracks closely. The rate of filing per 1,000 businesses is similar to the rate of filing per 1,000 population, but not always. Rhode Island is an exception and so is Wyoming.
Download this chart: PNG
| # | State | Per 1k biz | Per 1k pop | 2020 | 2024 | 5-yr | CAGR |
|---|---|---|---|---|---|---|---|
| 1 | Maryland | 3,359 | 76.6 | 353,467 | 478,536 | +35% | 7.9% |
| 2 | New Jersey | 1,936 | 48.4 | 268,293 | 459,722 | +71% | 14.4% |
| 3 | Nevada | 1,922 | 45.1 | 70,285 | 146,844 | +109% | 20.2% |
| 4 | Georgia | 1,750 | 40.4 | 250,952 | 452,281 | +80% | 15.9% |
| 5 | Nebraska | 1,702 | 47.8 | 78,614 | 95,857 | +22% | 5.1% |
| 6 | Kentucky | 1,571 | 32.0 | 100,288 | 146,924 | +46% | 10.0% |
| 7 | Indiana | 1,541 | 34.2 | 112,116 | 236,926 | +111% | 20.6% |
| 8 | Alabama | 1,508 | 30.7 | 109,505 | 158,423 | +45% | 9.7% |
| 9 | Arizona | 1,407 | 29.8 | 148,846 | 224,940 | +51% | 10.9% |
| 10 | Missouri | 1,380 | 34.0 | 142,208 | 212,253 | +49% | 10.5% |
| 11 | Rhode Island | 1,317 | 35.0 | 30,737 | 38,831 | +26% | 6.0% |
| 12 | Utah | 932 | 24.9 | 62,143 | 87,310 | +40% | 8.9% |
| 13 | Michigan | 897 | 20.2 | 112,782 | 204,460 | +81% | 16.0% |
| 14 | North Dakota | 804 | 25.4 | 14,562 | 20,190 | +39% | 8.5% |
| 15 | District of Columbia | 774 | 26.7 | — | 18,471 | — | — |
| 16 | New Mexico | 751 | 15.8 | — | 33,666 | — | — |
| 17 | Delaware | 742 | 20.6 | 21,084 | 21,665 | +3% | 0.7% |
| 18 | New York* | 674 | 18.3 | — | 364,412 | — | — |
| 19 | Pennsylvania | 668 | 15.8 | 95,592 | 205,411 | +115% | 21.1% |
| 20 | Texas | 666 | 14.0 | 242,938 | 437,823 | +80% | 15.9% |
| 21 | Wyoming | 654 | 25.9 | — | 15,164 | — | — |
| 22 | Connecticut | 550 | 13.4 | 23,036 | 49,078 | +113% | 20.8% |
| 23 | Iowa | 466 | 12.1 | 25,425 | 38,976 | +53% | 11.3% |
| 24 | Massachusetts | 359 | 9.2 | 28,340 | 65,741 | +132% | 23.4% |
| 25 | Wisconsin | 324 | 7.9 | 38,883 | 46,806 | +20% | 4.7% |
| 26 | Alaska | 314 | 9.4 | 5,314 | 6,942 | +31% | 6.9% |
| 27 | South Carolina | 299 | 6.6 | 25,896 | 36,097 | +39% | 8.7% |
| 28 | Florida | 290 | 7.9 | 132,828 | 183,643 | +38% | 8.4% |
| 29 | Puerto Rico | 275 | 4.2 | 6,965 | 13,576 | +95% | 18.2% |
| 30 | New Hampshire | 269 | 7.5 | 7,274 | 10,570 | +45% | 9.8% |
| 31 | Illinois | 254 | 6.5 | — | 82,034 | — | — |
| 32 | Maine | 220 | 6.8 | 6,364 | 9,519 | +50% | 10.6% |
| 33 | Vermont | 191 | 6.2 | 3,570 | 3,987 | +12% | 2.8% |
| 34 | Idaho | 146 | 4.2 | — | 8,337 | — | — |
| 35 | Minnesota | 140 | 3.7 | 11,645 | 21,656 | +86% | 16.8% |
* New York, mapped from its own court data to the national definition.
Embed this ranking
The full ranking as a standalone, embeddable table. Includes the required "Source: DocsGenie" link.
Five years of growth
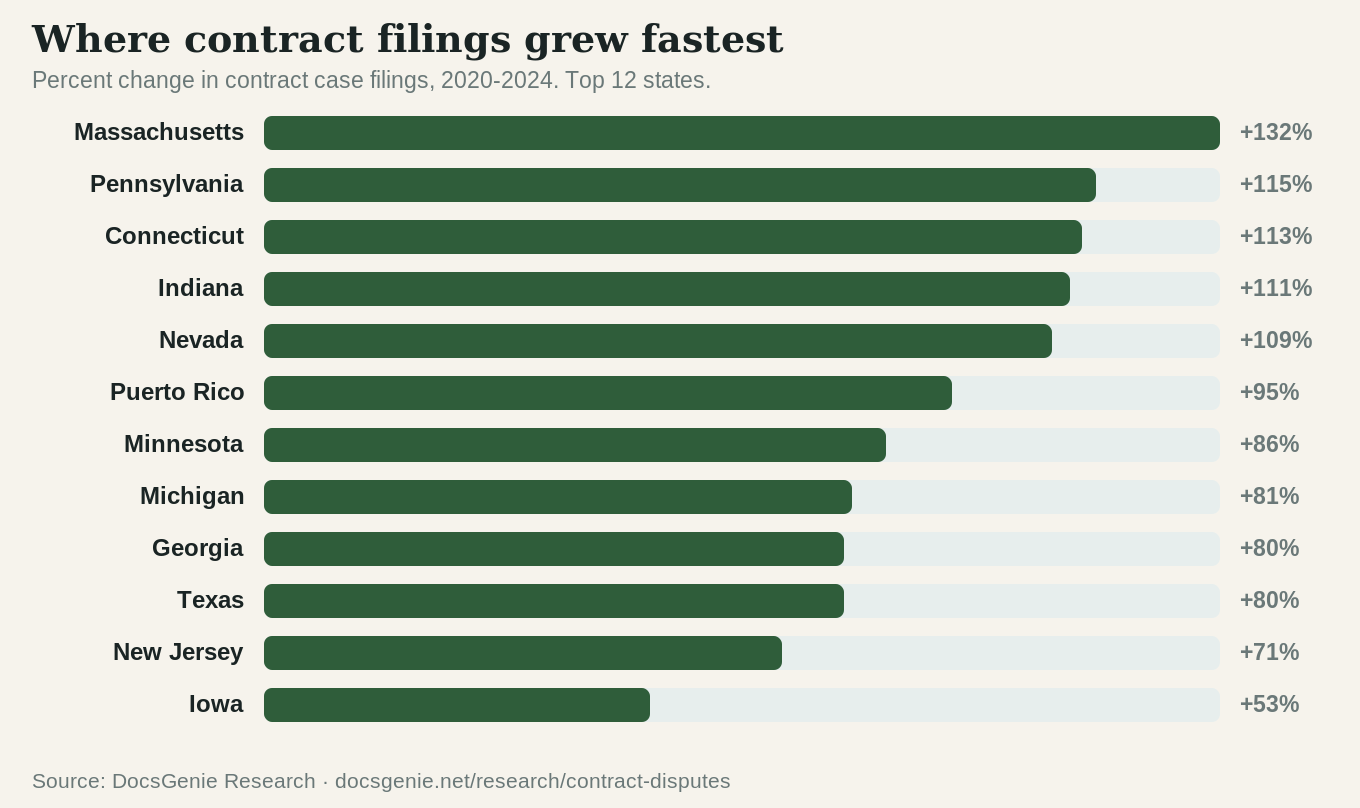
The five-year picture is unambiguous: contract filings across the 29 full-coverage states rose 62.7% between 2020 and 2024, an annual rate near 13%, and not a single one of those states declined. Growth was led by Massachusetts (+132%), Pennsylvania (+115%), Connecticut (+113%), Indiana (+111%), and Nevada (+109%).
The timing matters. The increase was not a clean 2020 pandemic dip and rebound; most states barely moved in 2020–2021, then surged in 2021–2022 as eviction moratoria lifted and debt-collection dockets reopened. The steepest single-year jumps (Minnesota +115%, Georgia +66%) cluster on that 2021-to-2022 catch-up.
Download this chart: PNG
Download this chart: PNG
The composition
"Contract" filings are a broad court category. Debt collection, landlord/tenant, and foreclosure dominate. Worth keeping in mind before reading these as purely commercial disputes.
Download this chart: PNG
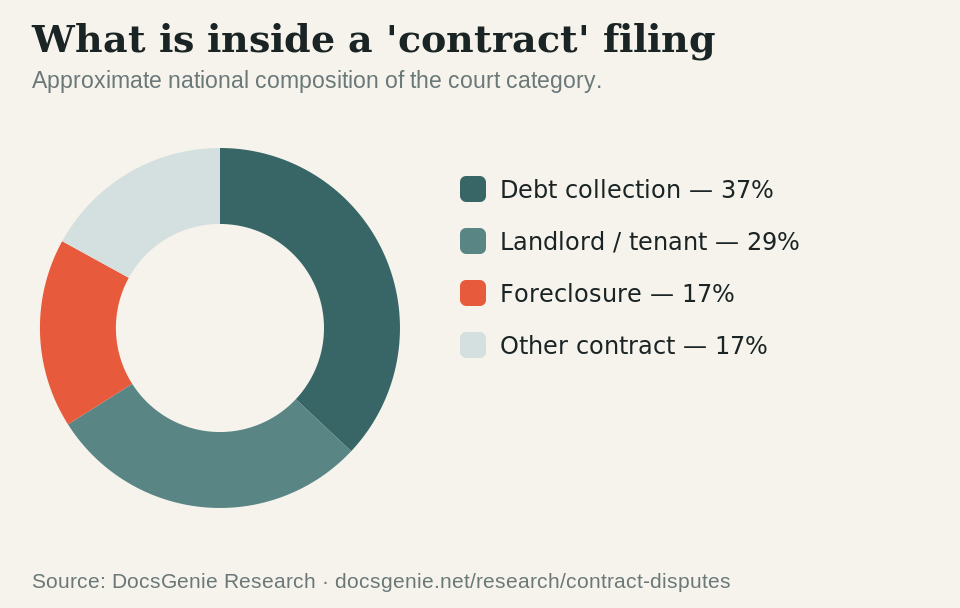
Shares reflect the NCSC national composition (approximate). The "Other contract" slice bundles buyer-plaintiff, employment, fraud, and other-contract cases, which the source does not split reliably by state.
Every bucket traces back to a document. Debt collection begins with a demand letter or a promissory note that wasn't honored. Landlord/tenant cases begin with a lease agreement and end with an eviction notice. Foreclosure is based on the deed securing the loan. And the "other contract" bucket is largely buyer-plaintiff and employment disputes. That ground is covered by bills of sale, employment contracts, and purchase agreements. DocsGenie drafts all of them, state by state.
Eight findings — one chart each
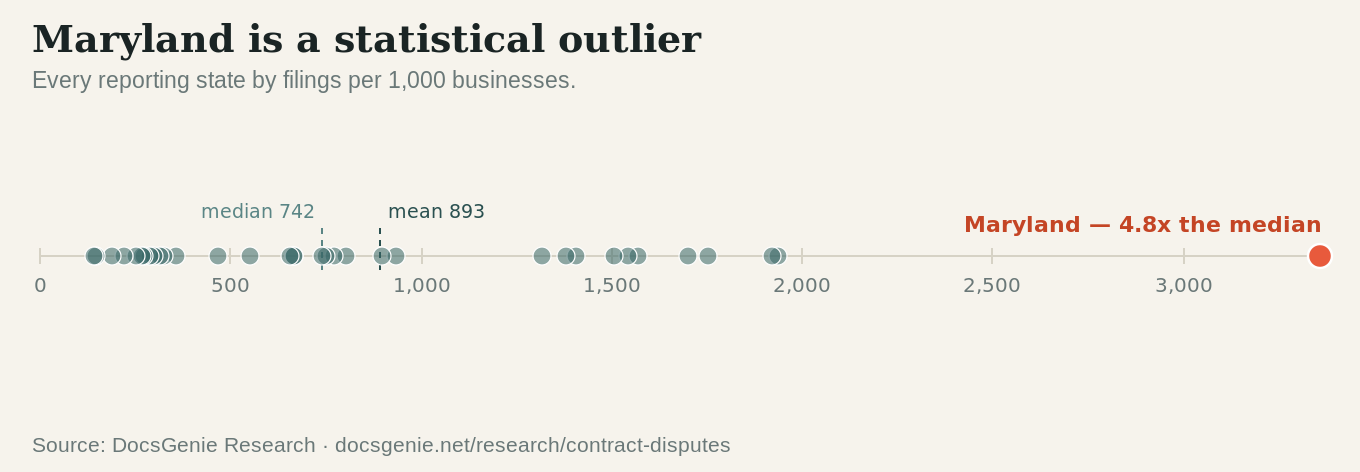
Maryland is a statistical outlier, not just rank #1
3,359 per 1,000 businesses against a mean of 893 and median of 705. That’s 3.5 standard deviations above the mean. This is structural, driven by how Maryland's District Court concentrates landlord/tenant and debt volume.
In Maryland, there’s a single statewide District Court in charge of landlord/tenant and small-debt cases. It has a streamlined process and it’s designed to be low-cost on purpose.
Landlords can file as soon as rent is late. Many landlords use this process to file every month a tenant is late which means a single unit can produce multiple filings in a year. Put another way, it’s often used as a rent collection tool as opposed to a true eviction tool. That said, Maryland does have the highest eviction filing rate in the country.
Download this chart: PNG
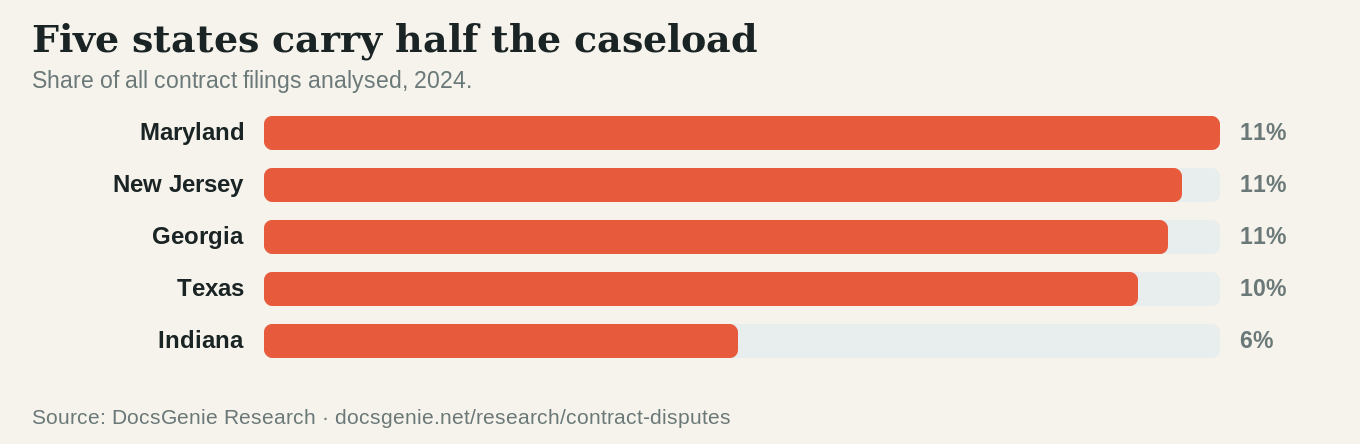
Filing volume is concentrated
The top five states account for 48% of all filings analyzed (Maryland, New Jersey, Georgia each ~11%, Texas ~10%, Indiana ~6%). A few dockets carry most of the load.
Download this chart: PNG
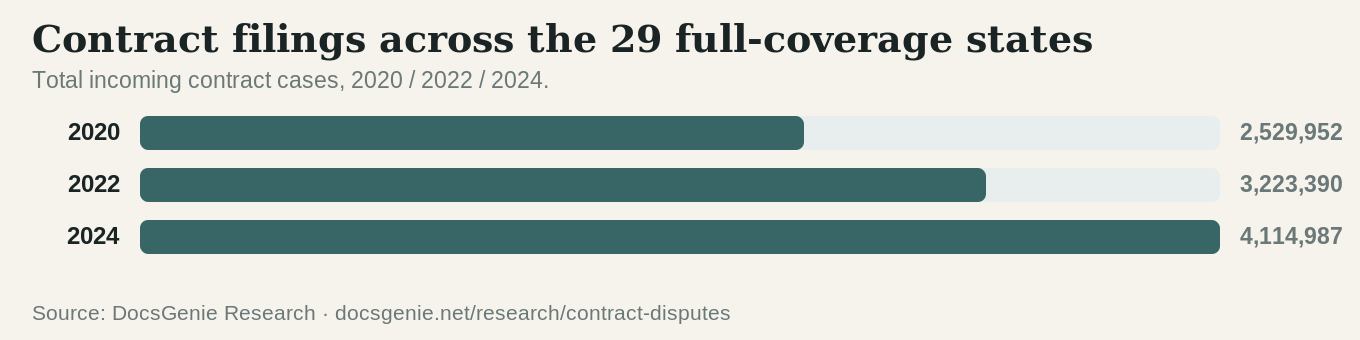
The surge was 2022, not a 2020 COVID dip
Only 13 of 29 states dipped in 2020–2021 (+5.6% aggregate), then filings jumped 54% through 2024. A post-moratorium eviction and debt catch-up wave concentrated in 2021–2022.
Aggregate filings across the 29 full-coverage states. The jump between 2020 and 2022 is the post-moratorium surge.
Download this chart: PNG
Flat national growth hides opposite trajectories
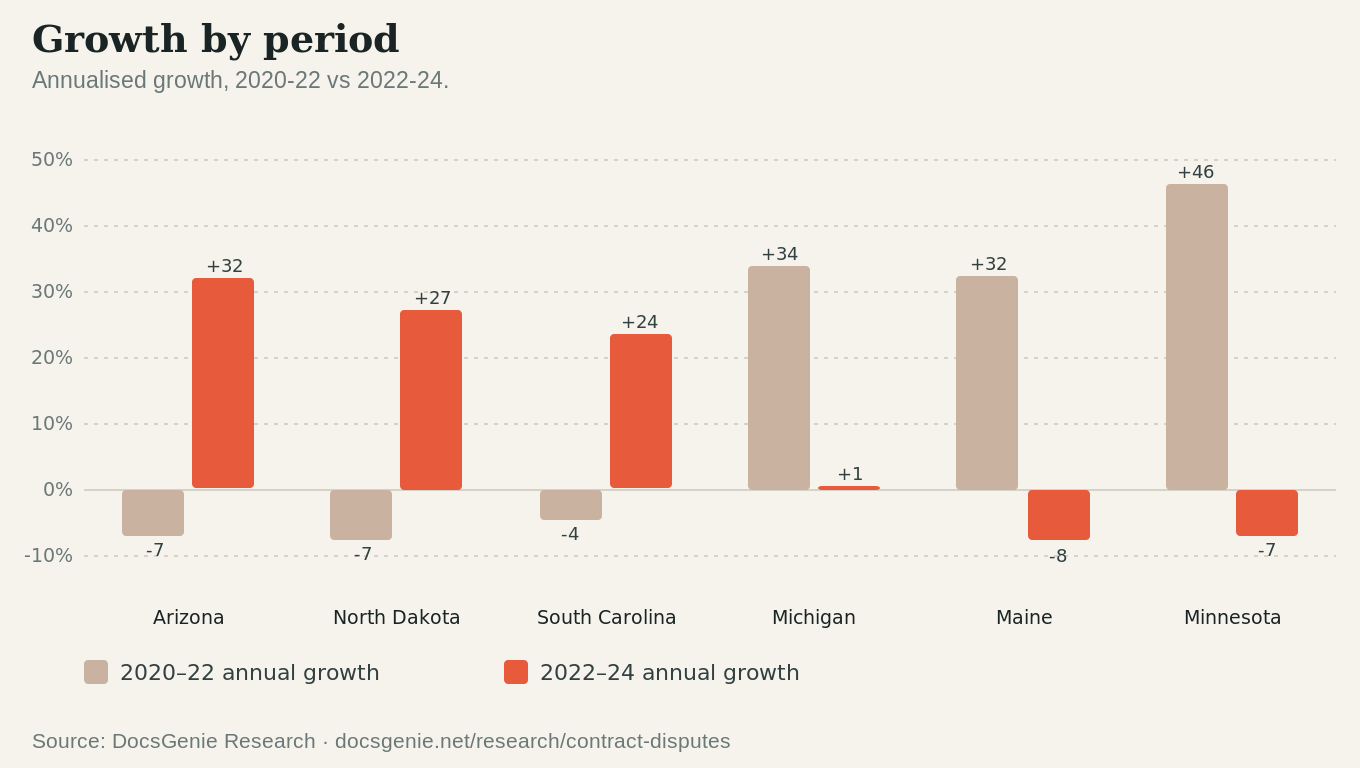
The national average grew at nearly the same pace in both halves of the period, but that masks opposite trajectories. Arizona, North Dakota, and South Carolina barely moved in 2020–22, then surged; Minnesota, Maine, and Michigan did the reverse, easing back from a 2022 peak. Crucially, all six still filed more in 2024 than in 2020. What diverges is the pace of growth, not the five-year direction.
Annualized growth in each half of the period. A bar below zero means filings eased from a 2022 peak. Every one of these six states still recorded more filings in 2024 than in 2020.
Download this chart: PNG
Litigation volume ≠ legal-market value
The correlation between a state's filing rate and its lawyer wages is essentially zero. High-filing states run 27–29 filings per lawyer. These are low-value, high-volume matters: assembly-line debt and eviction processing, as in Maryland, rather than commercial litigation.
Download this chart: PNG
An ADR desert
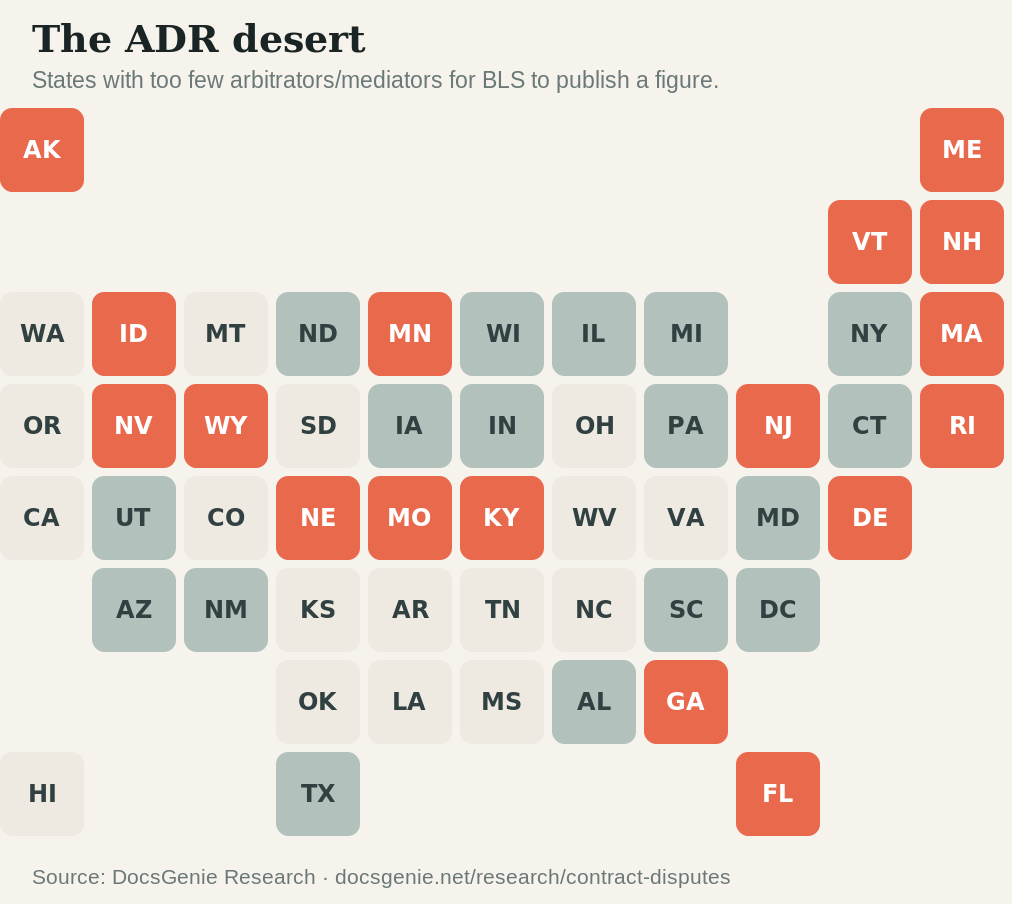
In 19 of 34 reporting states, so few people work as arbitrators or mediators that the BLS won't publish a wage figure for them. A withheld number means very few, not zero, even as contract filings climb about 13% a year.
Download this chart: PNG
More businesses does not mean more disputes
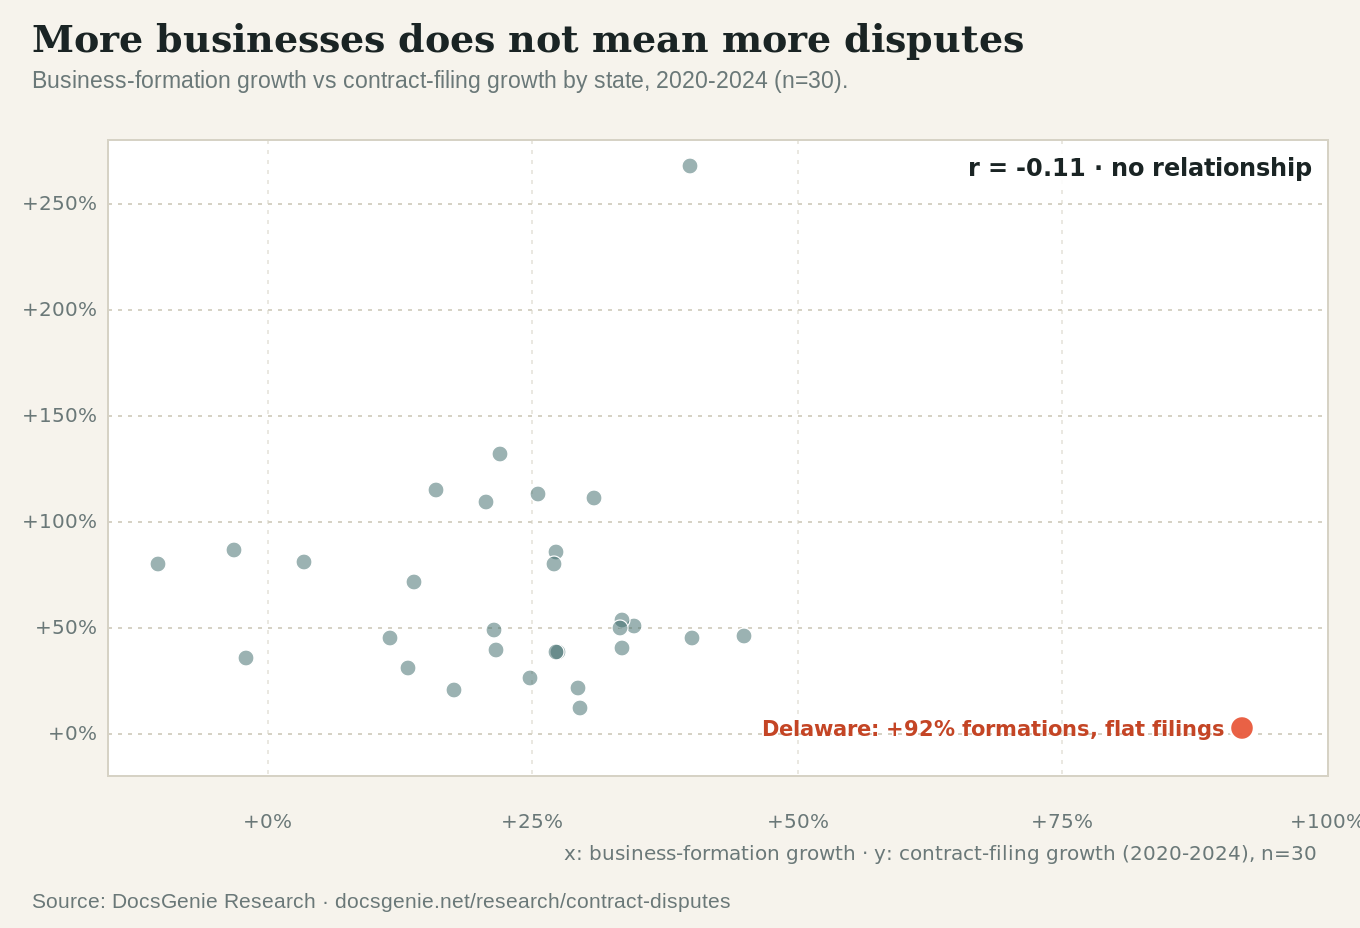
The correlation between business-formation growth and filing growth is -0.11. Essentially none. Delaware's +92% formation boom is an LLC/shell-company artifact, not organic activity, so a 'formation drives disputes' story does not hold.
Download this chart: PNG
The paperwork behind a real formation: LLC operating agreements and partnership agreements.
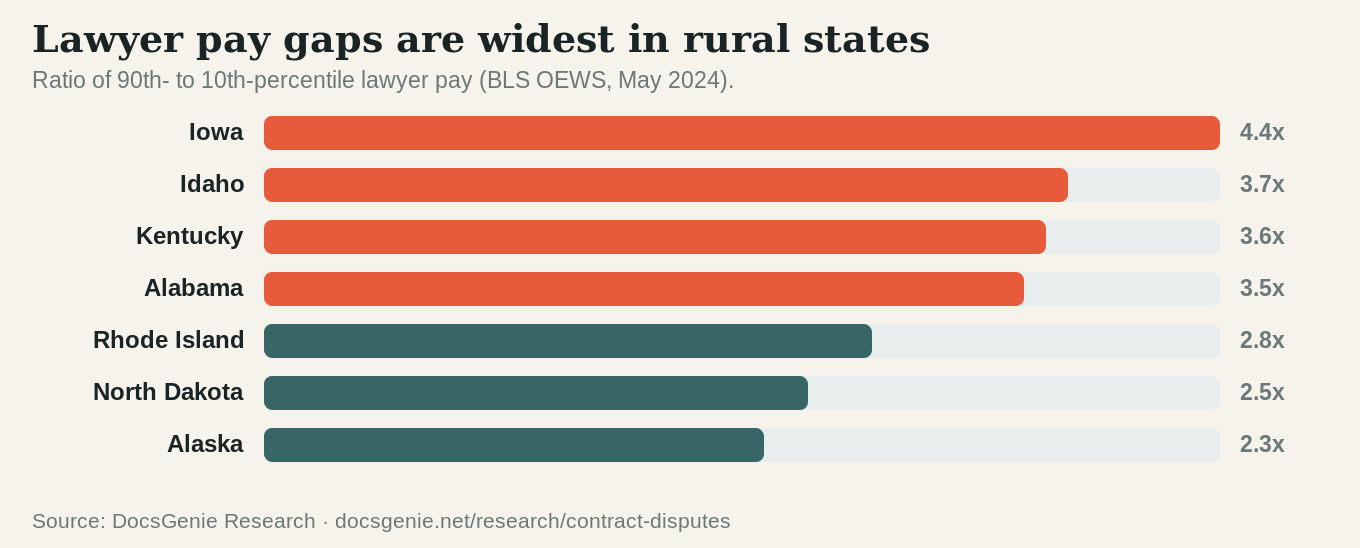
Lawyer pay gaps are widest in rural states
The P90/P10 pay ratio is widest in Iowa (4.4×), Idaho (3.7×), and Kentucky (3.6×), and narrowest in Alaska (2.3×) and North Dakota (2.5×).
Download this chart: PNG
What a dispute is worth
What a contract dispute is worth is largely a function of legal labor, and that cost varies widely by state. Average lawyer pay runs from about $109,000 in Montana to $254,000 in California, with a median state near $152,000. Any dollar-per-dispute figure combines these citable wage rates with an assumption about hours. That hours figure is a model we own and label as such, not a government statistic.
The takeaway is less about geography than case type. Legal pay varies about 2.3x from the cheapest state to the priciest, but it does not track where disputes are filed. The busiest states are not the highest-wage ones. Because debt-collection and eviction cases dominate these dockets, and many resolve by default with little contested attorney time, the biggest driver of what a dispute actually costs is not the hourly rate. It is whether the case is fought at all.
Highest average lawyer wage: California ($254,170). Lowest: Montana ($109,190).
Methodology & sources
Numerator: incoming contract case filings from the NCSC Court Statistics Project, 2020–2024. Denominator: business establishments from Census SUSB (2022, the latest vintage, a roughly two-year lag). Population from Census 2024 estimates; wages from BLS OEWS, May 2024; business formations from Census BFS.
Because no 2024 SUSB exists, both normalized cross-sections share the 2022 business base, and the per-capita view (2024 filings ÷ 2024 population) serves as a lag-free corroborator. New York is mapped from its own court data to the NCSC definition. Under that definition, contract filings include debt collection, landlord/tenant, and foreclosure cases alongside commercial disputes; every aggregate is scoped to reporting states and is not a U.S. national total. Claims are descriptive, not causal.
For press & reuse
Free to republish, including the charts and the dataset, with attribution and a link to this page. Every chart above has a PNG download beneath it; email us for any chart as SVG. Need a custom cut, a state-specific chart, or a quote? [email protected]
docsgenie.net/research/contract-disputes. Free to republish charts and data with a link to the source.